Bybit offers different accounts tailored for specific purposes, helping traders efficiently manage their funds. This guide explains how to use the Assets Overview page to monitor your fund distribution across various accounts and understand the average cost of your assets on the App/on the website.
Accessing the Total Assets Overview
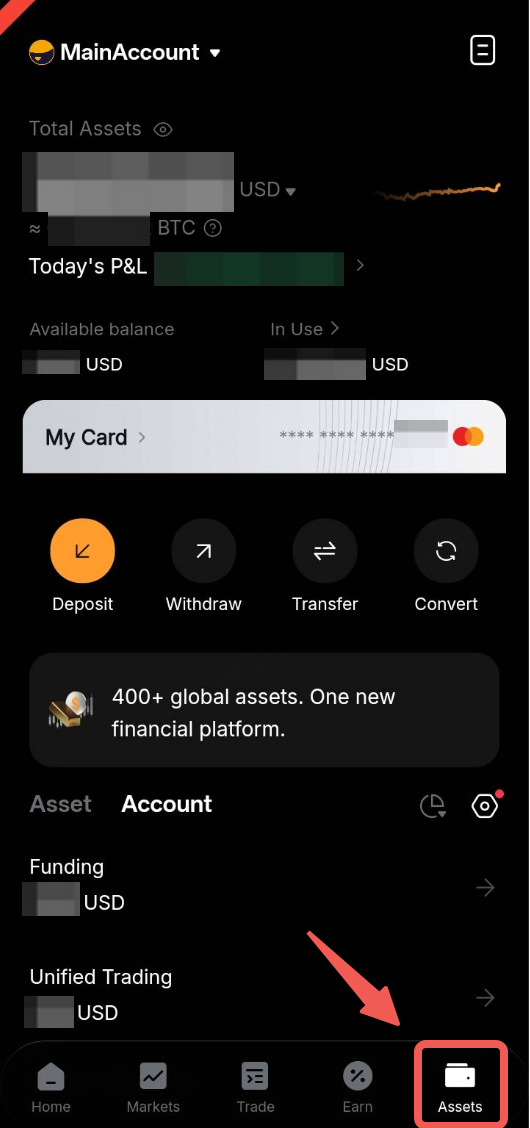
To access and manage your assets, tap on the Asset button and tap on the Total Assets.
Key Sections
Overview
Now, let’s have a closer look at the different account pages and the functionalities available within them.
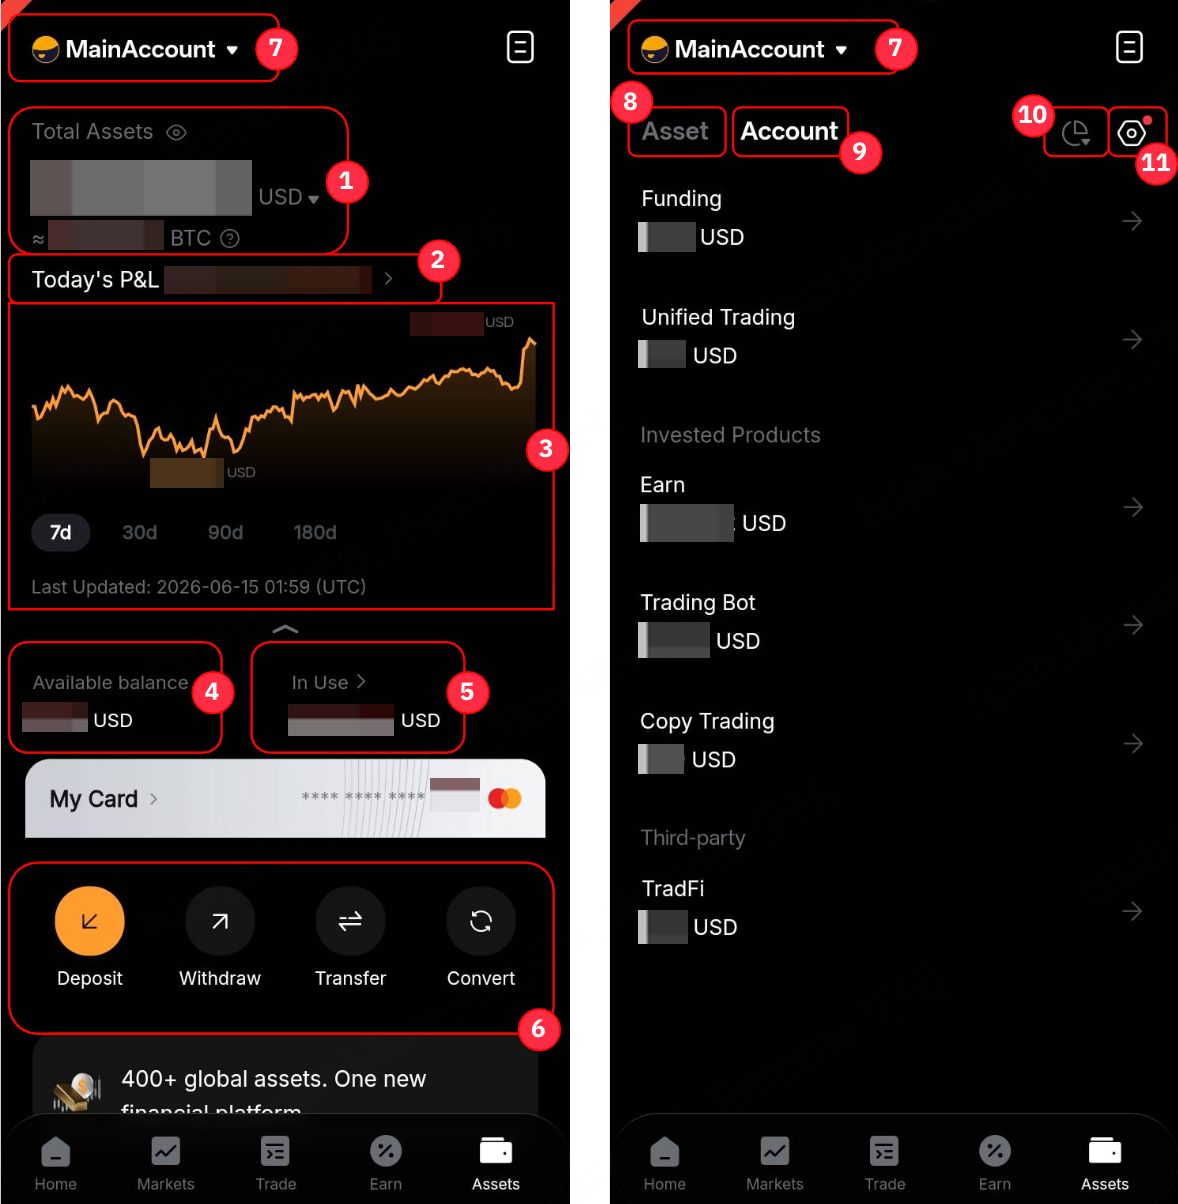
1 | Total Assets | - This section displays the total equity of funds across all your accounts, shown in your chosen crypto and fiat currencies.
- By default, the cryptocurrency is BTC while the fiat currency is USD. You can change the currency display of your crypto and fiat assets from the available dropdown menu. Alternatively, you can change the fiat currency display in the User Center page.
- Use the eye icon to toggle the visibility of these amounts.
|
2 | Today’s P&L | - Today’s P&L = Current Total Equity - Initial Equity at 12AM UTC Today - Total Asset Inflow + Total Asset Outflow Since 12 AM Today)
- This will direct you to the P&L Analysis page. For more information, please refer to here.
|
3 | Assets Chart | Expand the Assets Chart to view the daily snapshot of your assets at 11:59PM UTC, with updates available by 4AM UTC in the chart. |
4 | Available Balance | This refers to the estimated amount of funds available based on the current margin mode. For more information, please refer to this article. |
5 | In Use | This section showcases the portion of your assets currently reserved across different products. |
6 | Key Account Management Functions | Quick access to account functions. |
7 | Switch Subaccount | Quick access to switch to your Subaccount. For more details, please refer to FAQ — Standard Subaccount. |
8 | Account | - This section summarizes your funds in each account.
- Please refer to the details below for the accounts that will be shown under Account Overview.
|
9 | Asset | - You can see the Amount, Average Cost of your current holding assets from both your Funding Account and Unified Trading Account (excluding unrealized profits and losses).
- For more information, please refer to the details below for the data shown under Asset Overview and its calculation.
|
10 | Asset Distribution (Pie Chart icon) | Tap the icon to display the percentages of where your assets are allocated across accounts. |
11 | Hide assets < $1 (Gear icon) | Toggle this button to hide all the assets with the value less than $1 or equivalent. |
Account Overview
In addition to the primary account, users can view the amount of funds invested in specific financial products as outlined below.
Asset Overview
From the asset overview, you can see your current asset holdings and its average cost. By tapping the respective assets, you can view additional key metrics such as Cumulative P&L (USD), Cumulative P&L (%) and the current Index Price of the assets.
Please note that these values update with changes in your asset amounts in Funding Account and Unified Trading Account. It is for reference only and does not guarantee absolute accuracy.
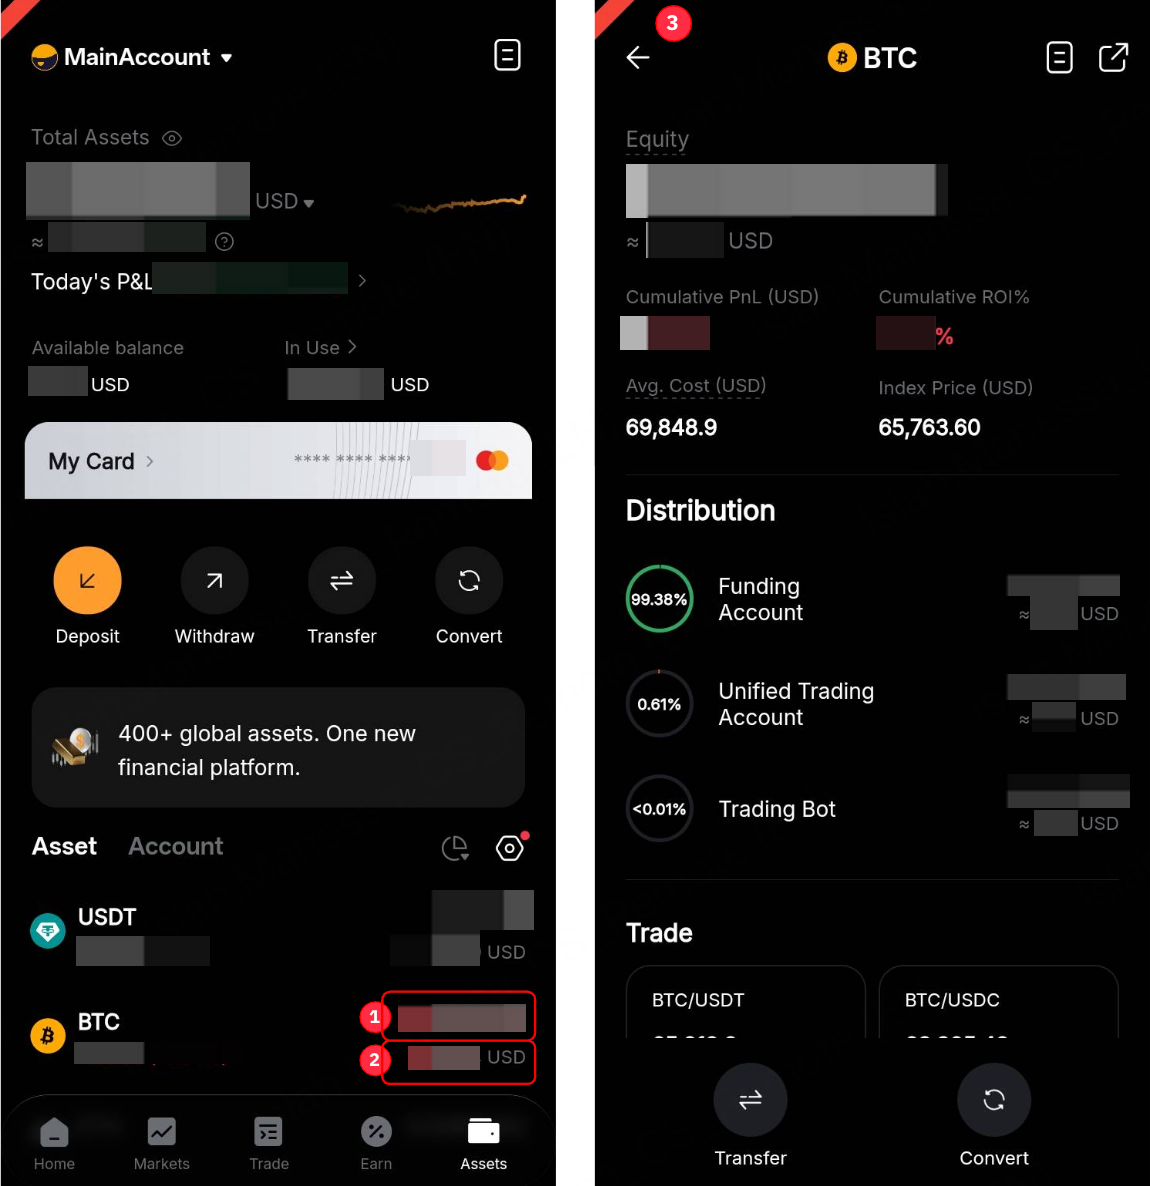
The calculation for each data is outlined as follows:
1 | Equity | - The quantity of Spot assets in your Funding and Unified Trading Accounts.
- Assets transferred out to other financial products investment, such as Bybit Earn, or Trading Bots, are excluded.
|
2 | Fiat Value | - This shows the estimated fiat value of your current Spot Assets in your Funding and Unified Trading Account.
|
3 | Details | - Cumulative P&L (USD) = (Current Index Price - Avg. Cost) × Current Amount
- Cumulative P&L (%) = Current Index Price - Avg. Cost) / Avg. Cost
|
